
By Jakub, June 08, 2021 · 5 min read
Our Internal CTA to improve the quality of ecommerce
While developing an ecommerce site, it’s really easy to forget about the most basic things, such as making sure your shop is constantly providing the best possible experience for end customers.
Let’s be honest - it may happen to all of us. We’ll forget to check if the shop isn’t too distractive in pursuit of new shiny features. While adding tools that help us in marketing campaigns, we won’t notice that the site is not behaving as fast and smooth as it used to. Of course, sooner or later someone would notice and instruct the developers to fix the problem. But why risk the “later” version when you can make sure everyone's is constantly up to date?
Tools are not an issue
It’s obvious for anyone who has worked in an ecommerce project that there are millions of tools that allow measuring a site’s performance: Google Analytics, New Relic, Page Speed Insights, you name it. It’s selecting, checking, and comparing the most important metrics that tend to be the problem. While everyone’s always doing their best, it’s hard to notice every decrease immediately. And why worry about discovering something too late, if there are better ways?
Equal responsibility
We, at Hatimeria, believe that everyone working on a particular project is responsible for its success. That’s why it doesn’t matter if the downfall in conversion rate or significant increase in page speed is caused by some third-party script or other external factors - we just want to know about it and make things right. And we want to do it ASAP.
That’s why we have developed an internal application that gathers the most important data about our projects and displays them in the form of weekly and daily charts. We decided to have both kinds of data because the first one allows us to make sure we follow the right path and make things better with each passing week. On the other hand, the latter lets us catch any anomalies and potential problems before they escalate.
...and access for all
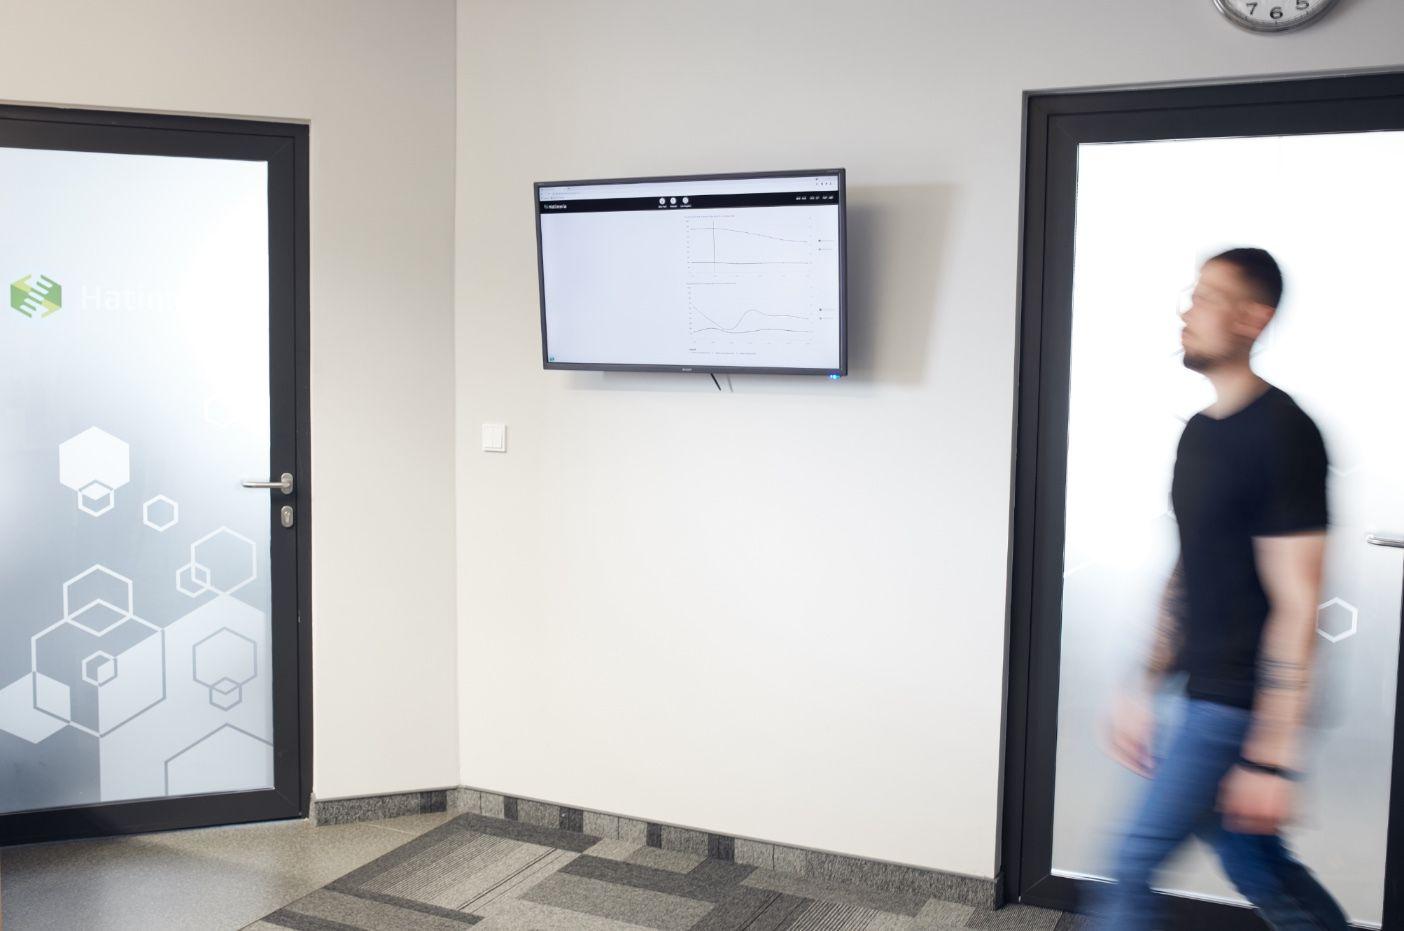
Everyone in the company can access the application in a matter of seconds. But that’s still not enough - we could’ve granted everyone access to the tools mentioned a few paragraphs above, so why bother? That’s why we’re displaying the application on a big TV in the kitchen where everyone comes to eat, drink coffee, or just to socialize. It’s really hard not to notice the charts and they can be a perfect starting point for a discussion that might turn into a great idea for an improvement. And for those who prefer to work from home or are too focused on their coffees and snacks, we are also sending the results to the project’s channels on Slack.
“Show me the money”
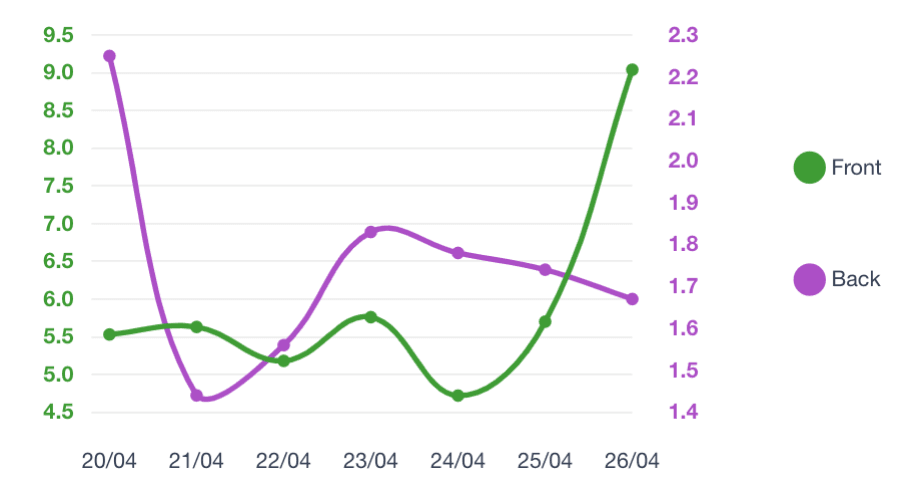
“And how’s that working out for you?” you might ask. It’s been going really well, thank you! We actually managed to prove that this is a good idea almost immediately. We’ve been working really hard to minimize server response time, and, as you can see on the screen below, it was working really well. One week though, we noticed that although we were on the right track with our main goal, it’s the page loading time we should take a look at because suddenly it went significantly up. We obviously did that as soon as possible and discovered that the additional third-party scripts added are slowing down the page. Fixing that was quite easy and, as you can see, we were able to celebrate another little success just one week later.

Not all issues are visible on the weekly chart though. For instance, we noticed that even though our weekly average page speed looks healthy, on one day the page was significantly slower than on the others. And it wasn’t the first time - we were closely monitoring the daily chart because we noticed this pattern before. It wasn’t obvious though if something really is happening or it’s just an accident. With a few hours of digging and a little help from our Dev Ops, we discovered that the increase in page loading time was actually caused by bots attacking our site. Ever since we dealt with this, our daily chart is back to normal.
It’s also clearly noticeable that overall motivation in the company to deliver the best solutions and make all metrics better with each passing week has quite literally snowballed since we started the project.
What’s next?
Even though our internal application has proven to be quite a success, we don’t plan on stopping. We have recently made sure that deployments are automatically marked on the charts so that we instantly know if any changes in performance may have been caused by our changes. We are still coming up with new ideas on how to make the application better and more efficient, who knows what the future will hold?
Would you like to innovate your ecommerce project with Hatimeria?

Lover of morning skydiving. Proud dad of little frenchie Furia. For him every day could be Pizza Day or Ramen Day or Burger Day or... yeah, that's our foodie guy.
Read more Jakub's articles