Marika
Age range: 18-24 (Females mostly)
Motivators to buy:
Discounts, Free shipping, Return timeLooking for:
Modern sunglasses, Good looking corrective glasses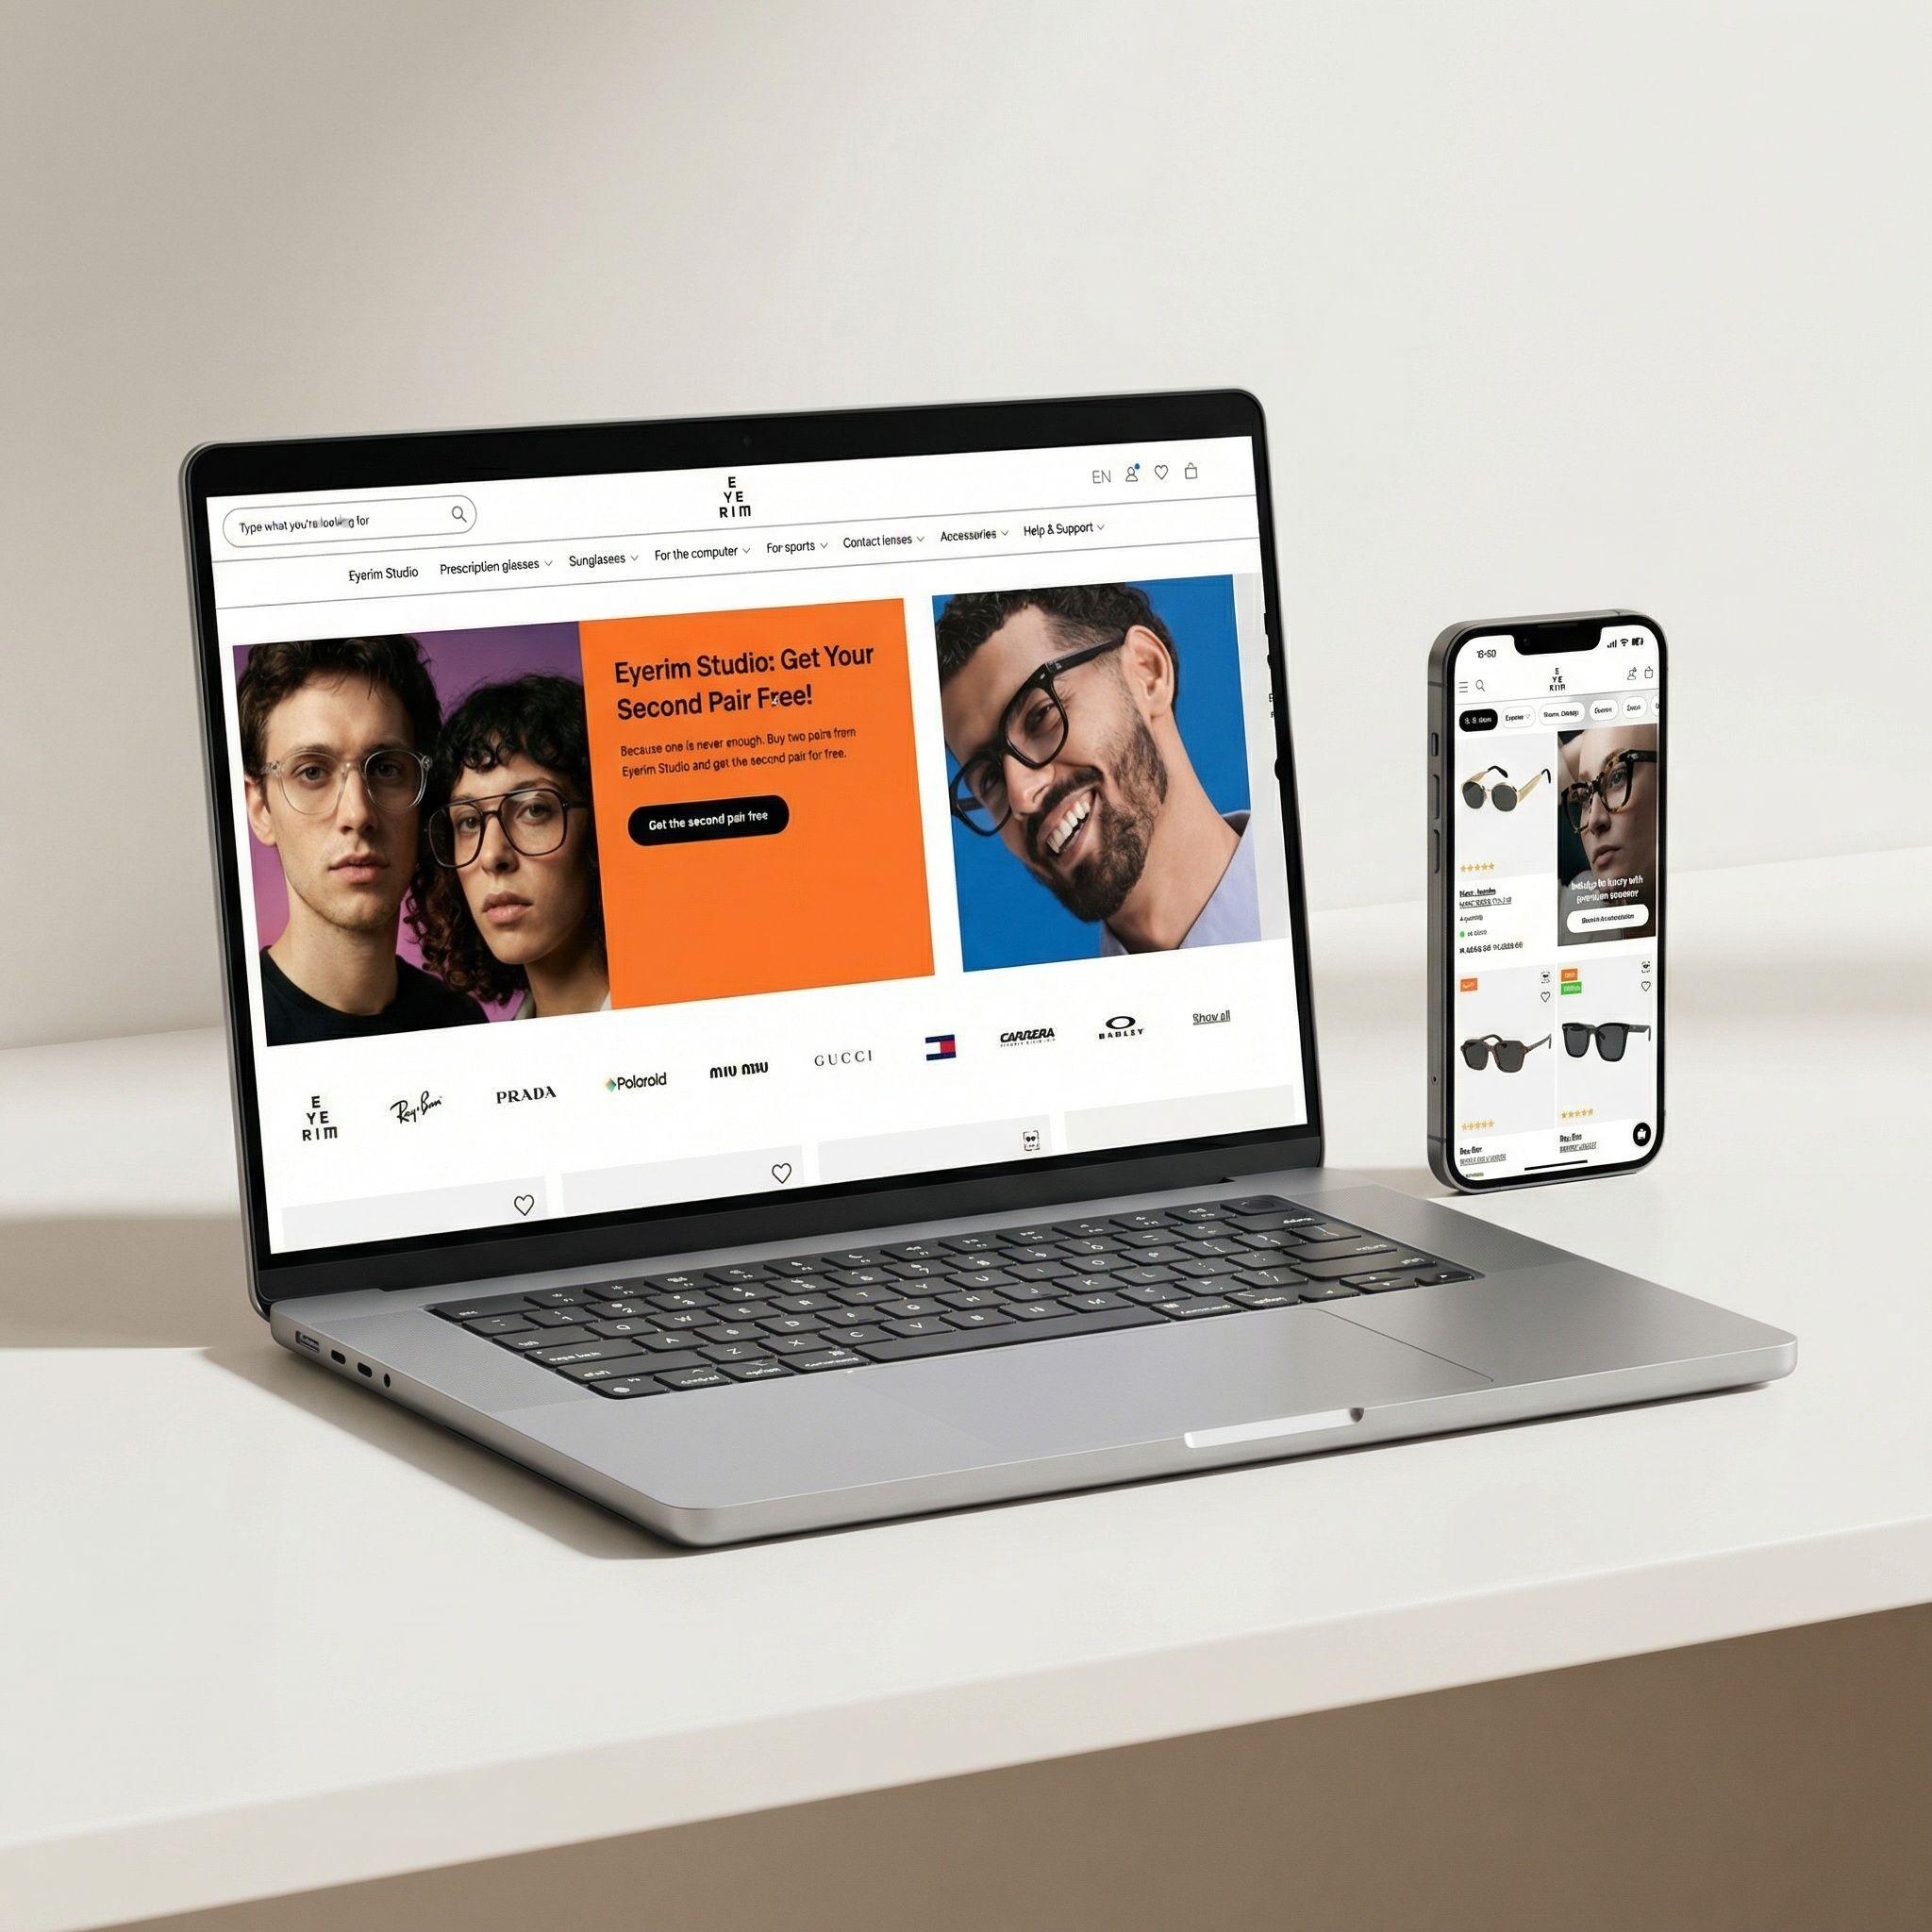
Eyerim.com is an online store that specializes in the sale of spectacles in 14 countries. It has over 75 brands in its assortment and is visited by over 500,000 users monthly.
Eyerim.com has decided to entrust the Hatimeria team with the improvement of the website usability, increasing its speed of operation and numerous development projects.
Eyerim is our long term customer - we started few years ago as pure development partner on early Eyerim's days and during last few years we were honoured to see and participate in this amazing leading glass industry brand creation.
Our team consists of both Frontend and Backend developers, as well as devOps engineers, UX specialist, System Administrators, and QA Engineers. Thanks to accumulating all types of skills at the same office, we are able to not just develop new features - but cooperate internally to be actively involved in Eyerim growth, by constantly improving the quality of Eyerim's ecommerce solution.
The involvement of various teams means also that we are able to make the client more aware of what can be done better so that his store will sell more while improving the comfort of using the store.
Before we have started the work, we prepared an initial action plan.
In the first step, we focused on analysing our client's direct online competitors - the similar online stores. We diagnosed their performance in the areas of UI, UX and users flow on desktops and mobile devices.
Next, we analyzed all kinds of data related to the users, the way they move on the site, also taking into account how they move on desktops and mobile devices.
We used four tools to conduct an analysis.

Based on the qualitative data obtained from Hotjar, we could learn where the users are encountering problems due to badly prepared interface or about programming errors that prevented access to the shopping cart. Hotjar also allowed us to review the common behaviour of users.
The quantitative data provided by Google Analytics has enabled us to determine the bounce rate and to obtain information on devices used to browse products on eyerim.com. It also provided very informative demographic data.
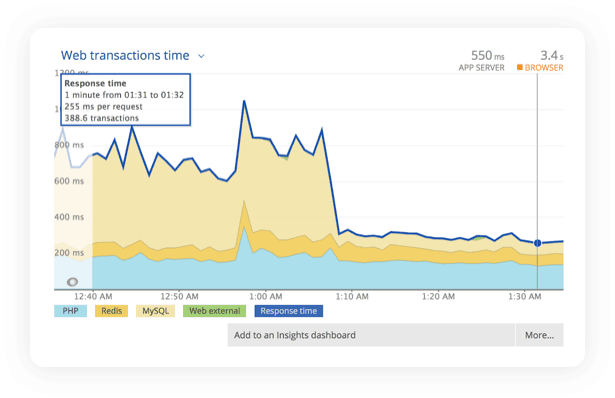
Hatimeria's QA engineers have been also monitoring basic indicators of well performing ecommerce system, using NewRelic and Google Analytics for last few months. Collating data gathered by them with UX team conclusions, allowed us to prepare more complete gameplan and prioritize goals.
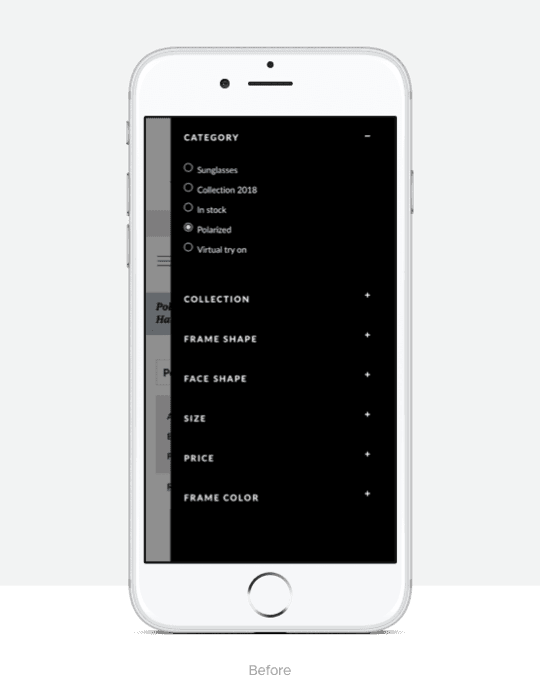
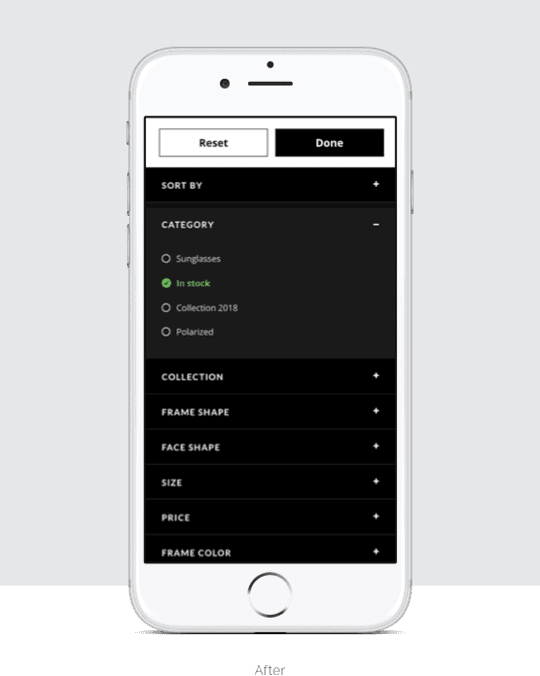
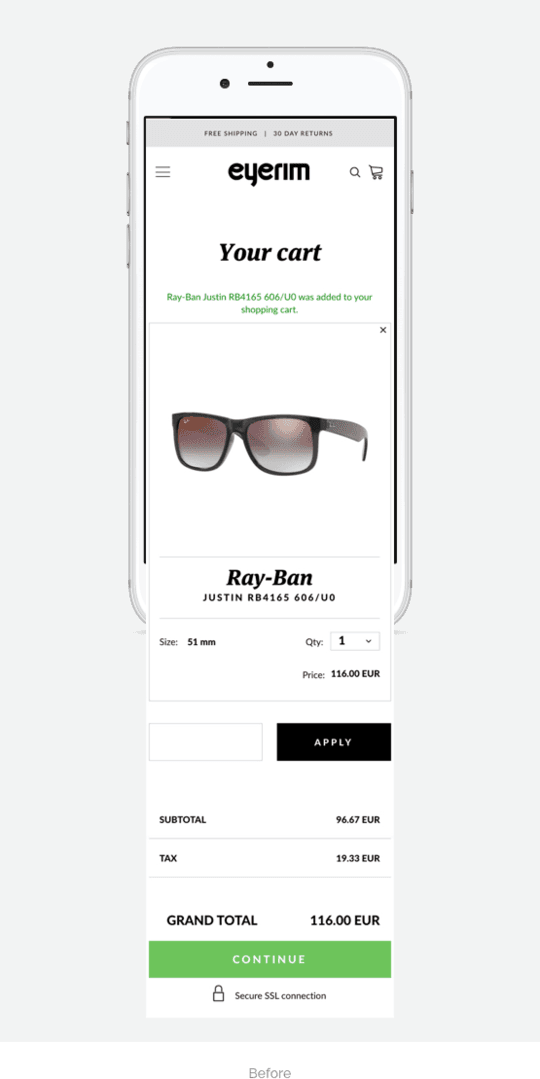
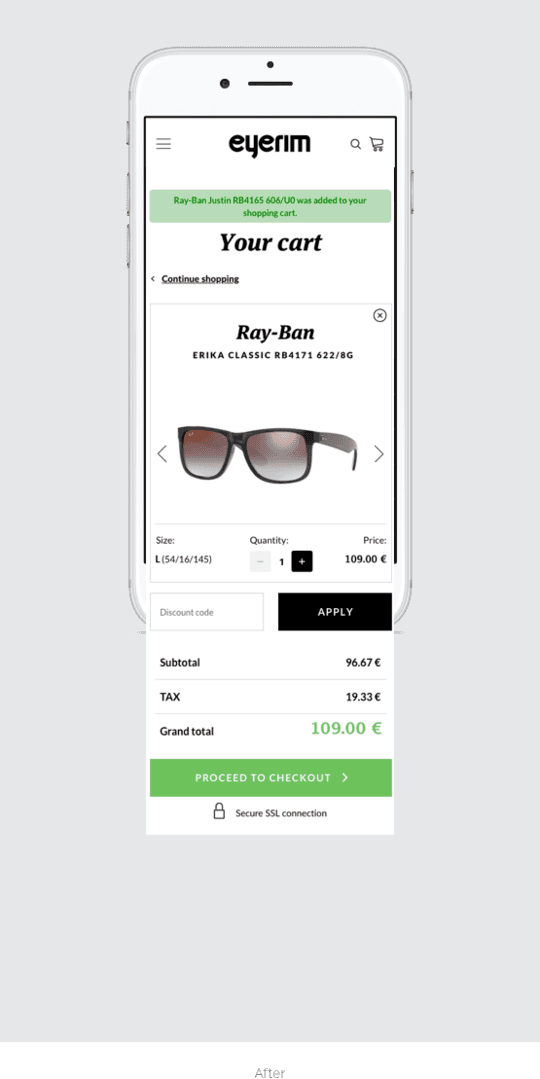
After pre-interviews with users, we have defined a few main problems
Then we conducted an expert analysis which showed us more issues to solve:
Before we have started the work, we prepared an initial action plan.
We wanted to learn what kind of users visit the website. This is why we decided to build a persona - a fictional character that represents a user type. It helped us to reflect and understand actions of the real users.We were able to define a proto-person in a short time thanks to the client who provided us with a wide range of analytical data and shared his feedback.
Age range: 18-24 (Females mostly)
Motivators to buy:
Discounts, Free shipping, Return timeLooking for:
Modern sunglasses, Good looking corrective glasses
Age range: 25-34 (Females and Males)
Motivators to buy:
Unique glasses, Free shippingLooking for:
Modern sunglasses, Corrective glasses
Age range: 35-44 (Males mostly)
Motivators to buy:
Trusted store, Return timeLooking for:
Unusual sunglasses, Elegant corrective glasses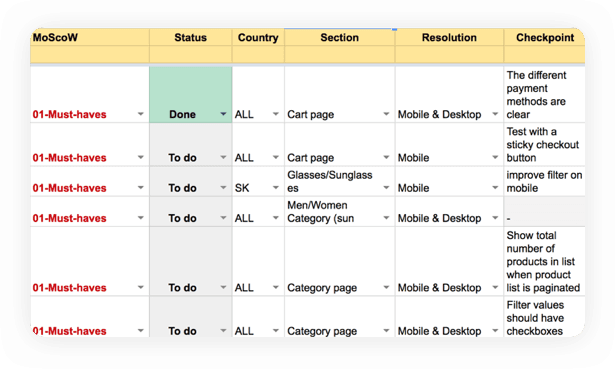


Simultaneously with the work of the UX & UI team, our DevOps team analyzed the data obtained in the initial phase of Blackfire and NewRelic. We have identified bottlenecks and planned to level them in cooperation with server administrators.
The most important points that contributed to increasing the efficiency of the eyerim.com store were:
implementation of ElasticSearch to work with and speed up category pages
optimization of SQL queries efficiency on a category, product, and home pages
improvement of cache usage to relieve the database work
improvement of frontend (images, CSS, compression) according to Google specialists
optimization of indexers and other background jobs that caused errors disrupting store’s operation
removing unnecessary records from the database to make it lighter
general server clean up to remove unnecessary files slowing down the IO operations
general JS scripts cleanup to remove scripts that were unnecessary or caused errors and increased page load time
the general review of web transactions, identifying suspected/unnecessary traffic and reducing it
In addition, we have eliminated numerous errors that have not slowed the page but have had an impact on its availability, eg: Server crashes and Server Unavailable.
The work we carried out brought positive changes in:
page load
response time
server uptime
We recorded a conversion rate increase by almost 30%, comparing the second quarter of 2017 (1.45%) with the second quarter of 2018 (1.87%). In turn, we analyze the first quarter of 2018 (1.69%) with the second quarter, and we see a significant increase of ~ 12%.
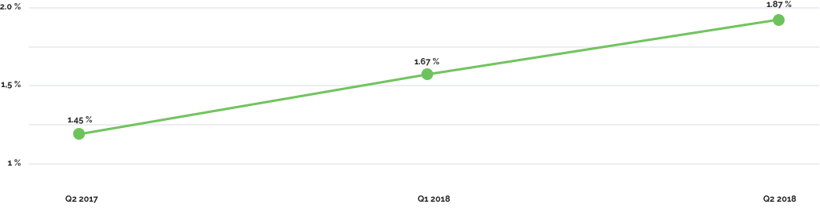
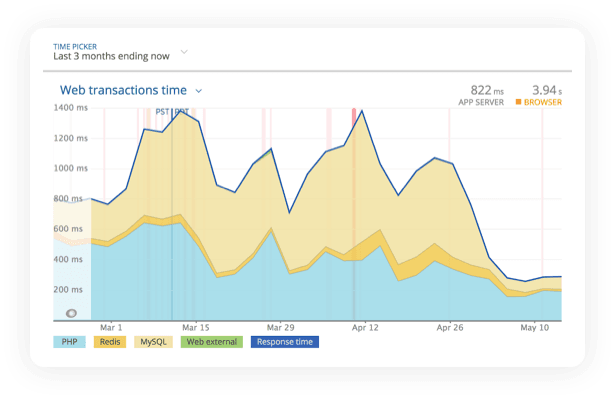
The increase in conversion is strongly connected with the decrease in page load time and server response time. The chart below shows how the page loading time decreased between the first and the second quarter of 2018.
At each stage of implementing changes, our QA team ensured that the changes we implement were perfect in every respect.
Thanks to UX & UI teams, DevOps, Developers and QA, we were able to react to the problems and improve the site on many many levels.
Currently, the implementation of several changes from the UX & UI list is planned by the end of 2018, and whenever this happens, we will expand the case study with relevant statistical data and additional tests.