

By Michał W. , February 19, 2021 · 6 min read
How to optimize frontend performance on an ecommerce website?
Find out how to improve ecommerce website performance, measure the outcome and fit it all into the budget with quick wins.
Faster websites = more traffic, now it is official
Ecommerce website users expect the best performance that matches the user experience of a native app and market leaders like Zalando or Instagram. Google is helping developers measure how users see the website performing and push website owners to improve. It is now official that soon this will also affect google organic search results - Core Web Vitals become ranking factor from May 2021.
Long story short: the fastest website gets the more organic traffic.
The key is to understand how to research performance issues, how to fix the most common ones on ecommerce websites and how to measure if the situation is improving. And of course to try to squeeze that into an always limited budget.
The following research is based on hundreds of hours of optimization of real high traffic ecommerce websites with the aim of giving the most effective hints.
How to measure performance ?
Core web vitals
Core web vitals are the metrics that measure and describe the performance of a website using real user data from google trackers data. Google provides a way to read the data for the past 30 days for any website using Page Speed Insights
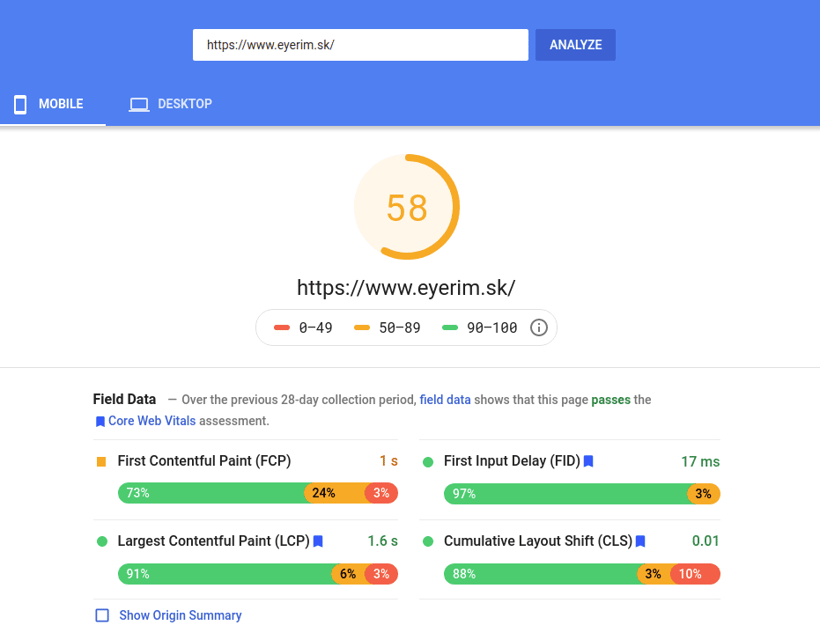
Here's an example from our project Eyerim that passes the Core Web Vitals and performs great even with a number of third-party scripts required by a business like Hotjar Facebook Pixel and are affecting the scoring.
Read more about excluding third party scripts from benchmarking.
Google Analytics
In its behavior section, supplementary Google Analytics provides:
- frontend load time that is similar to time to interactive from Page Speed Insights
- server response time to show overall backend performance
- connection times that could point to servers/network issues
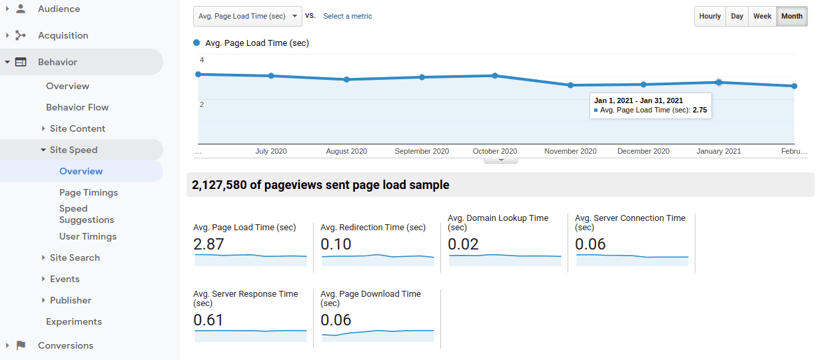
The big advantage of using GA is defining segments to answer questions such as: how is the website performing on a mobile device for first-time visitors?
Using the month view is a great way to show trends, day-by-day numbers can vary based on third party resources like scripts or audience fluctuations for example first vs returning visitors ratio.
Google Lighthouse
It's a free tool from Google that allows to run a single simulated mobile device performance test on a desktop computer. It can provide a great and detailed report, but at the same time, the measurement error could be absurdly high as well as the provided recommendations could be worthless when applied literally.
Under the hood it tries to automate finding the bottlenecks with general algorithms that oversimplify data. It often misses the real cause of performance issues that experienced software developers can uncover within a few hours of research.
Other
There are many tools that provide additional information or different views on the performance data. For example NewRelic Browser can be a great addition to monitor Single Page Apps performance or to track the frontend errors affecting real users.
No matter what you are using, create a spreadsheet and note values to monitor the trend. Saving the data from Page Speed Insights every week or two is a great idea to start tracking the progress.
How to find performance issues?
There are two resources that limit page speed - the CPU and the network. The browser tries to use those resources to get a rendered page to the user as soon as possible.
The developers' job is to add hints about what is important and has to be loaded first. A common problem is that a CPU or Network is idle because the browser doesn’t know in advance what to process.
For example Magento 2 has many JavaScript files that need to be downloaded and executed for the browser to find that ... there are more JavaScript files to be downloaded. In the process the CPU and the Network are not used effectively and continuously.
Using Google Chrome performance tab to analyze how a page is rendered is a great way to find inefficiency in how hardware and bandwidth are used on a particular ecommerce subpage.
Common ecommerce website issues:
- loading checkout assets (css, javascript) on catalog pages
- missing lazy loading of images from different sources like cms
- start loading chat/reviews and optional features before core features are loaded
Common optimization-inducted issues:
Witch-hunting performance issues can lead to opposite effect when changes applied actually make the situation worse.
Some examples:
- applying 3x 2x bigger images designed for high density screens like Retina on iPhone to all users, even those on fast 3g connection and mid-tier devices with no quality difference between 3x and 1x images
- lazy loading of in viewport images making them discoverable by the browser later on - after downloading and executing the lazy load js library
- JavaScript bundle that went wrong
The drastic visual overview on Magento 2 optional JavaScript bundling that is supposed to be improving website speed can be watched in action in a great video made by Magento core developer Andrew Levine
Top quick wins
A few quick wins from my experience are especially helpful for ecommerce websites. One of my favorites is the hero image that surprisingly is rarely used and can give great results in the implementation of a time to value aspect.
Hero image for LCP (Largest Contentful Paint)
Every page has a main image covering most of the viewport on mobile. For an ecommerce website that would be:
- the first product image from a gallery on a product page
- a category page banner or a first product listing image
- the homepage's first slider image
The LCP metric measures the time that is required to download that image. Often browsers discover such images late in the render cycle when they are already using all of the device's bandwidth to download other resources like tracking scripts.
By adding a hint for the browser we can make sure that its download will begin early on.
Read more in a great article about how to preload hero images
Read more
Check 5 quick wins for performance with estimated implementation time.
Coming soon is a more technical and in-depth write-up: how to analyze performance using Google Chrome performance tab.
Would you like to innovate your ecommerce project with Hatimeria?

Addicted to Twitter, discoverer of new technology trends and most cutting-edge ecommerce solutions. Mountain man. His dream gift is a Tesla but will not disdain a Maserati.